.
Most S&P 500 Stocks No Longer Trade Above Their 50-Day Averages: A Healthy Correction or the End of a Bull Market?

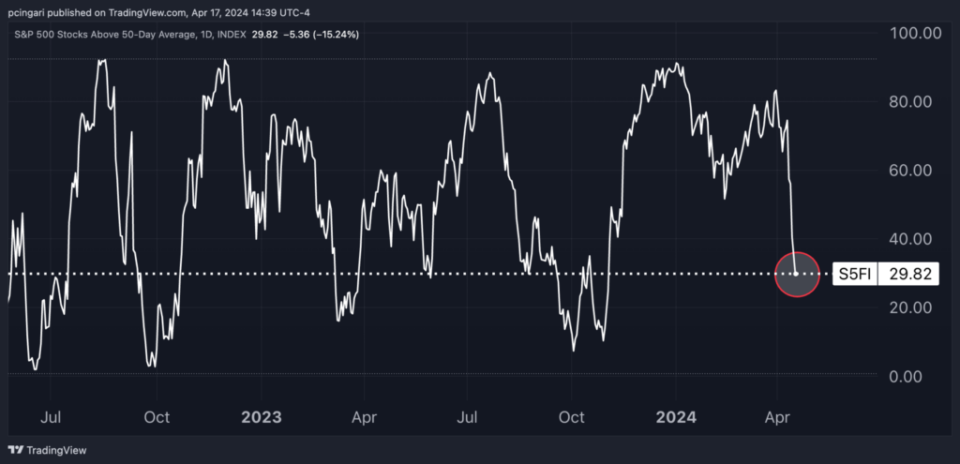
For the first time since early November 2023, fewer than 30% S&P 500 stocks are trading above their 50-day moving averages, a clear indicator of poor market breadth since then.
This sharp decline from 85% at the end of March and 92% at the beginning of January underscores the sharp reversal in market dynamics.
The 50-day moving average is often used as a barometer of a stock's short-term health. A drop below this level indicates that most of the stocks in the market are under downward pressure.
This shift came against a backdrop of escalating geopolitical tensions in the Middle East and renewed inflation concerns, which together prompted traders to take a more cautious stance in April.
Wednesday.SPDR S&P 500 ETF TrustFund (NYSE:SPY) closed down 0.3%, its fourth consecutive session in the red. This is the longest losing streak since early January.
Chart: less than 30% of S&P 500 stocks traded below their 50-day moving average

Worries about inflation
Inflation rose to 3.5% in March, exceeding economists' expectations and continuing a three-month upward trend.
"Rather than giving us greater confidence, the recent data clearly suggests that it may take longer than expected to realize that confidence," Powell said on Wednesday.
This sounds like an official postponement of hopes for a rate cut. The outlook for interest rates has changed significantly due to stubborn inflation.
The futures market currently expects the Fed to cut rates by about 40 basis points by the end of the year, or less than two quarter percentage points.
S&P 500 Outlook: Going Bubbly?
Investment analysts are closely monitoring these market developments.
Experienced InvestorsEd Yardeni) recently predicted that the S&P 500 could retest its 200-day moving average near 4700, which would represent a "classic 10% correction.
"The S&P 500 is experiencing its first real volatility of the year," said Adam Turnquist, chief technical strategist at LPL Financial.
The index is down 3.9% in April and has begun to "do some technical damage". Notably, the S&P 500 has broken out of its short-term uptrend and below its "20- and 50-day moving averages (dma)", with the 5,000 mark becoming the next key support level.
Turnquest emphasized that the longer-term breadth metrics are stronger, with "nearly 70% of S&P 500 components still above their 200-day moving averages (dma)."
"He added: "The lack of major disruptions to the long-term breadth of the aggressive sectors suggests that bullish leadership remains stable despite the recent jitters.
Technology Strategist, Bank of AmericaStephen Suttmeier) emphasized that 12 consecutive months of positive year-over-year returns for the S&P 500 may bode well for the future.
The data suggests that if this trend continues for at least 20 months, by November 2025, the index could rise by as much as 17.1% (6,150 points).
However, Suttmeier warns of near-term risks. During the typical election-year volatility of April and May, the S&P 500 struggled to break above the 5200 midpoint, suggesting that near-term challenges may lie ahead.
If the index falters, support at 5000, 4800 and 4600 will be critical.
Both the 3-month VIX and the percentage of stocks above their 50-day moving averages show a lack of deep oversold conditions compared to historical levels, suggesting that the market may need to be further corrected to establish a stronger low.
Read now Fund managers most optimistic since 2022: 'Bullish sentiment has not yet reached near sell-off levels'
Photo Shutter
"The Secret Weapon of Active Investors" - Power up your stock market game with the #1 "News and Everything Else" trading tool: Benzinga Pro - Click here to start a 14-day trial!
Get the latest stock analysis from Benzinga?
This article Most S&P 500 Stocks No Longer Trade Above Their 50-Day SMA: Healthy Correction or End of Bull Market? This article originally appeared on Benzinga.com.
© 2024 Benzinga.com. Benzinga does not provide investment advice. Press Release: Press Release: Press Release: Press Release: Press Release: Press Release: Press Release: Press Release: Press Release: Press Release.